Learn about introduction to graphs
Last updated : 29 June 2024, Saturday
Verified for accuracy
Rectangular Coordinate System
- The x and y axes form the rectangular coordinate system
- These axes divide the plane into 4 areas called quadrants
- As shown In figure below the quadrants are counted anti clockwise starting from upper right, namely quadrant I, II, III, IV
- Every point in the system is represented by ordered pair (x,y). x is x coordinate of point (x,y) and y is the y coordinate of point (x,y)
- Example: For marking point (3,4) draw x=3 and y=4, the intersection gives the point (3,4)
- Referring to point (x,y), in quadrant 1, both points are positive, in quadrant 2 x is negative and y is positive, quadrant 3 has both x and y negative, quadrant 4 has x positive and y negative
- Point (0,0) is called the origin

Graphing Linear Equations in 2 variables
- The graph of linear equation Ax+By = C is a straight line, every point on the line is solution to the equation and every solution to this equation is point on this line
- Example: Graph of y=2x-3 is given below which is a straight line
| x | y |
| 1.5 | 0 |
| 4 | 5 |
| 0 | -3 |
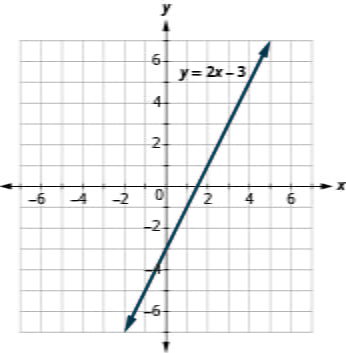
- x intercept of a graph is the point where y is zero, means point where graph cuts the x axis. In above example, point (1.5,0) is x intercept of line y=2x-3
- y intercept of a graph is the point where x is zero, means point where graph cuts the y axis. In above example, point (0,-3) is y intercept of line y=2x-3
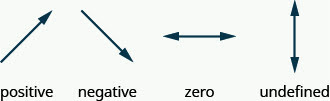
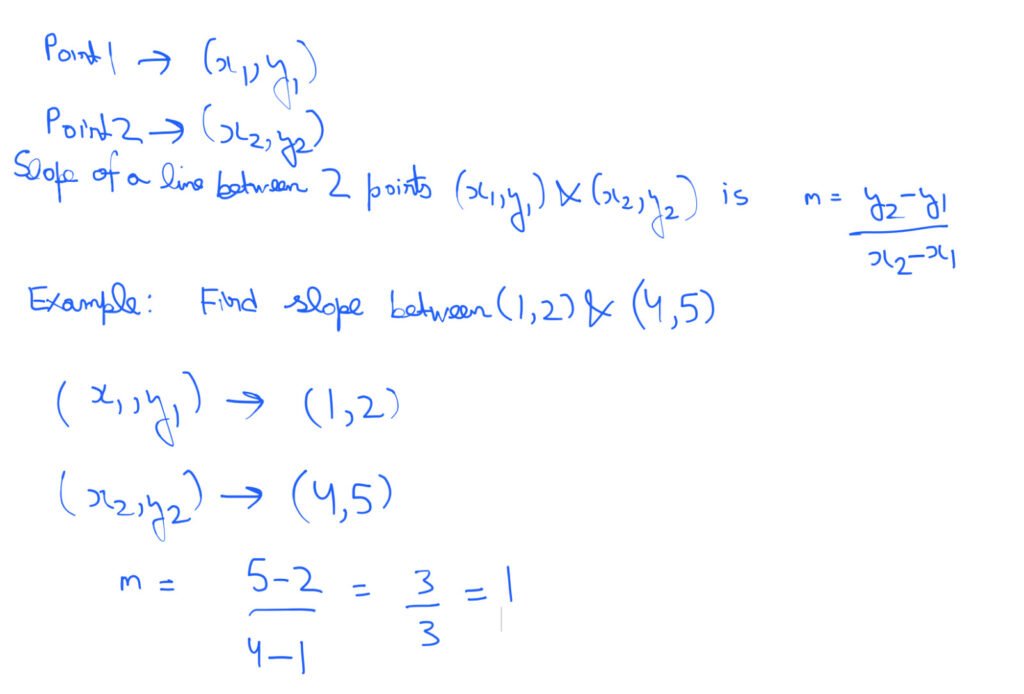
Slope of a Line
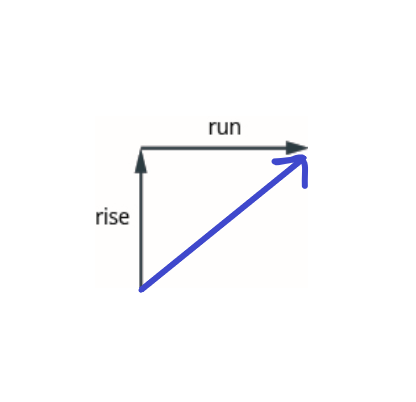
- Slope of line, m, is rise over run
- Rise is vertical change and run is horizontal change
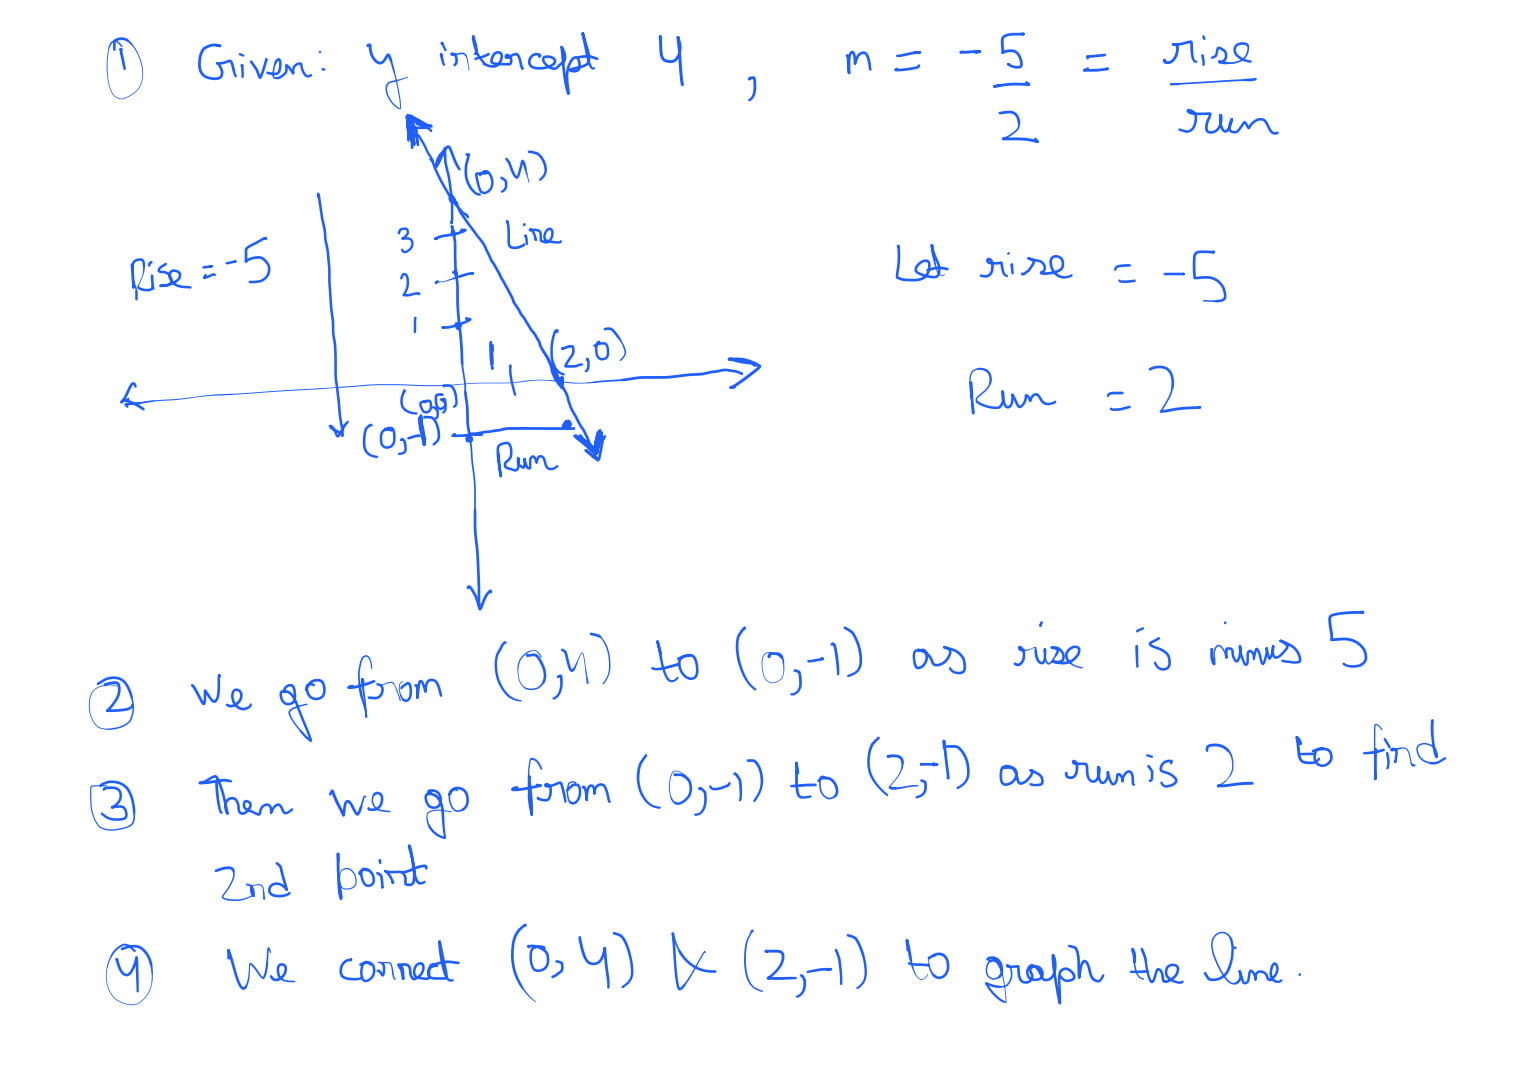
Graphing a line given a point and the slope
- Plot the given point
- Identify rise and run using the slope formula m=rise/run
- Starting at given point, count the rise and run and mark the second point
- Connect the points with a line
- Example, Graph the line with y intercept 4 and slope= -5/2